A few demo dashboards and Tableau skills I have mastered; sometimes in junction with Alteryx to handle data processing. Examples have been posted on my public tableau profile: https://public.tableau.com/app/profile/nick.belgau
Example Dashboard: Rats in NYC
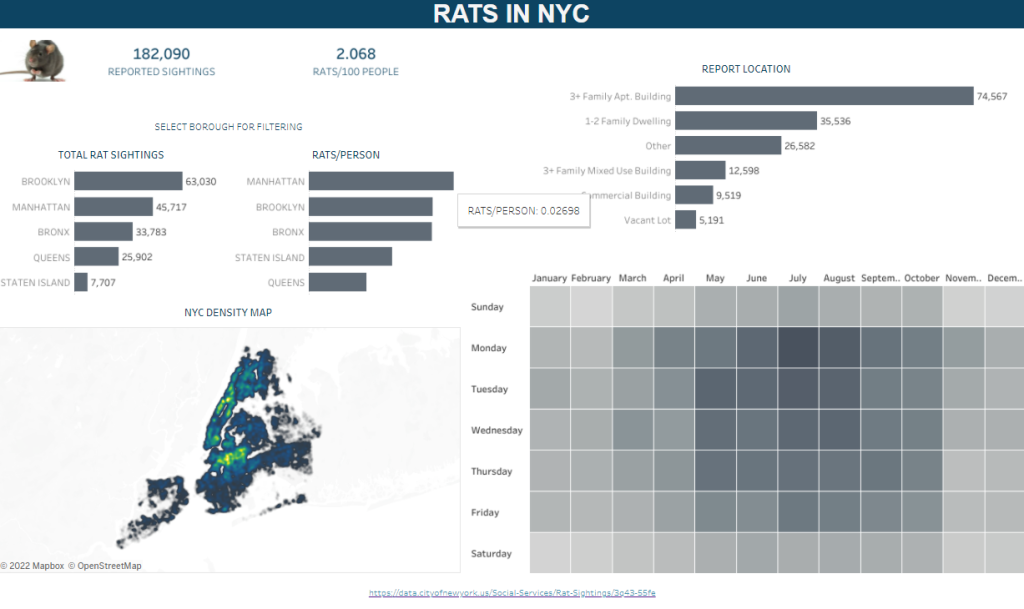
A public dataset on rat sightings in New York was collected and joined with population information about the respective boroughs. This allowed for the development of standardized metrics using Tableau’s Calculated Fields. For data not readily displayed such as Rats/Person by Borough, I use the Tooltips (hover) to reward the user for their curiosity. For this specific dashboard, I used Dashboard Actions to filter the views upon selection of Borough or Report Location.
Example: Parameter Controls
The below figure covers the use of Parameter Control to allow the user to focus on the struggling aspects of their business. A sidebar from a strategy review meeting might lead to the team drilling down into the categories in the red. By developing a “Bottom N Filtering” Parameter, the team can filter down into the categories negatively impacting the bottom line. This sort of interactivity rewards the user for their curiosity and leads to more meaningful discussions.
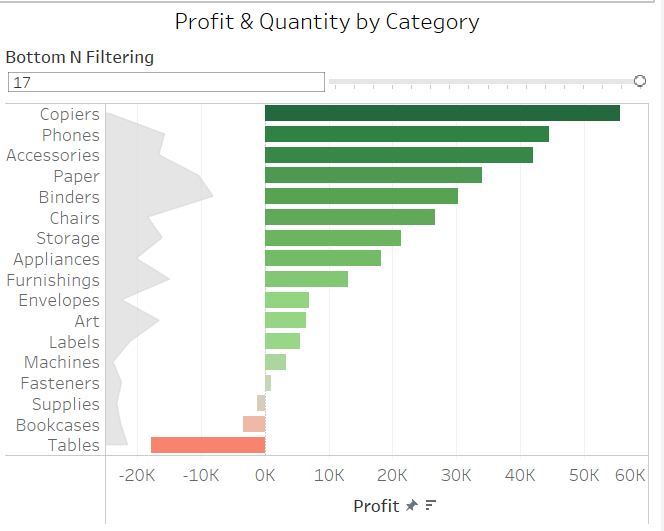
This same example also features another drilldown component: to filter profit data and subcategories by location. Here we can see that selling binders in Texas is not only the biggest loser in this state, but it’s also unusual since binder sales are net positive for the country. If the team could address this issue, Texas might elevate it’s sales ranking from dead last.

Example Dashboard & Data Aggregation
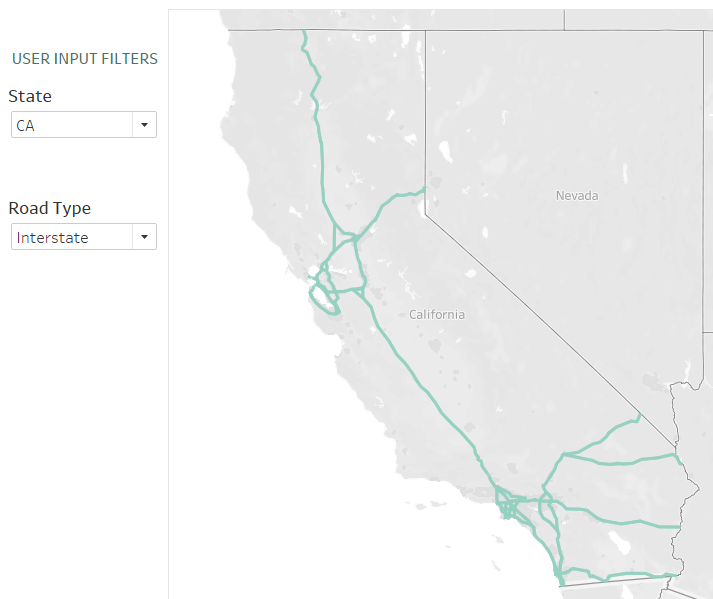
U.S. roadway data was gathered from census.gov for each state, but the final dataset required that the sources be concatenated and joined together. Alteryx was employed for data munging and creating a combined dataset by matching FIPS number to the paired State.

The FIPS number was extracted from each file source using the “Formula” module and concatenated with other shape files through a “Directory” search. An INNER JOIN was utilized to match the country data to the general FIPS table by the FIPS number. The dataset was then complete, exported as a .shp file, and imported into Tableau.

Filtering was utilized to allow the user functionality to drilldown by STATE and ROAD TYPE in the dropdown menus.
Road Type was grouped and placed on the Tableau Mark Shelf, highlighting the interstates.
Additional fields were utilized for the tooltip details, as to return clear information back to the user.