Feb 2021
This following is an example analysis that I did into an interesting and growing company. All data was public, and I was not contracted to perform this work. This is not a deliverable; it is an example to showcase my python skills and early-stage exploration.
A real dataset was copied from Company’s website and merged with data queried from Google Places API to gain insight into what the public is saying about each store location.

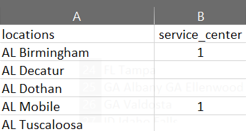
Company’s dataset was copied from an online PDF into excel and cleaned using VBA script and other techniques.

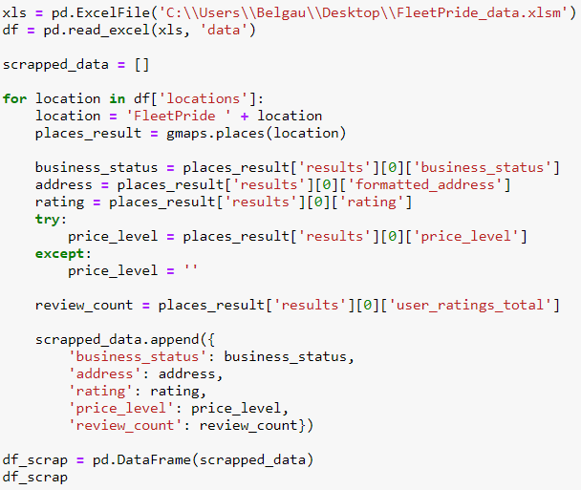
Each store location had its Google Reviews queried using the Google Places API, and concatenated with the cleaned excel file.
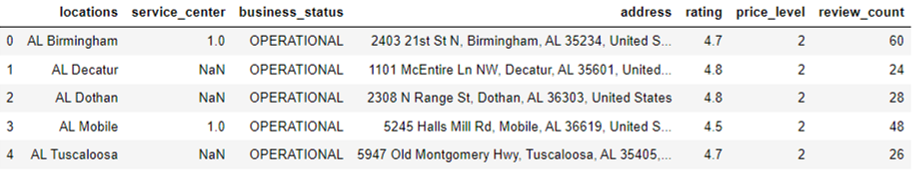
The final dataset was uploaded to a Jupyter Notebook for analysis using Seaborn and Pandas.
Initial understanding of the data includes handling missing & null values, assessing duplicates, and removing locations no longer in service according to Google. More details can be found on my GitHub, as I won’t bore you with all that now.
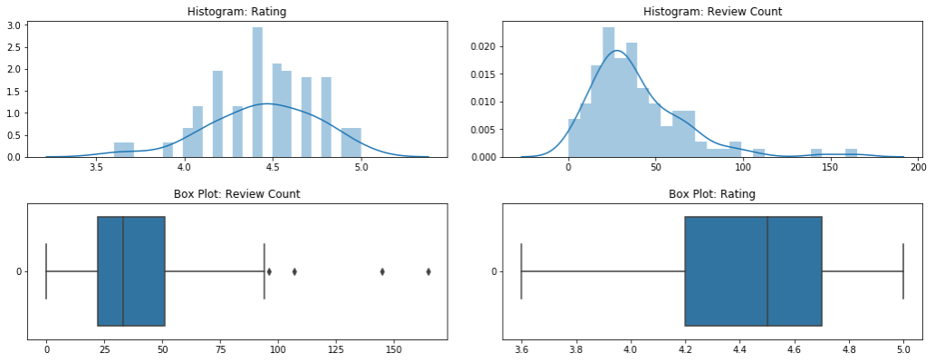
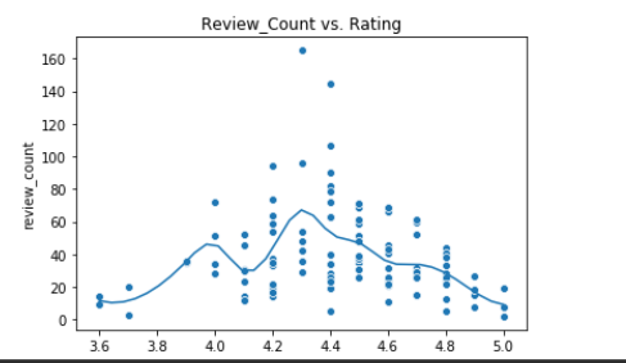
There may be an interesting relationship between review_count and rating, as the initial heat map (not shown) showed some correlation.
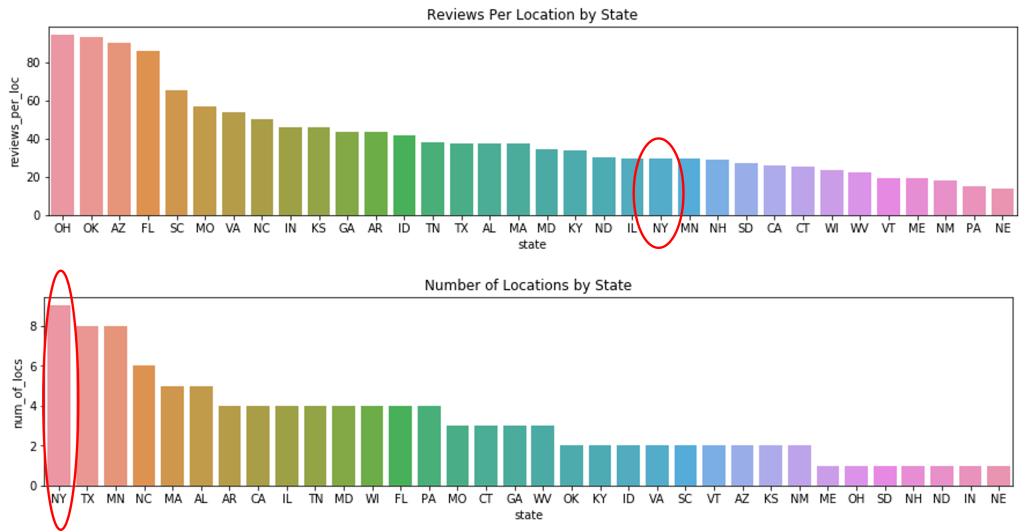
Applying simple groupby’s allows us to begin asking questions about the categories. Why does New York have so many locations, but low number of reviews?
Drilling down into each NY location, we can assess how various metrics change after removing a particular store that has low reviews. Sorry for not truncating the decimal…

The analysis continues in my GitHub, but hopefully this provides some understanding of my capabilities to gather, critically assess, and visualize the data.
